Primer: Energy Systems, incentives, and models (Article)

Why you should care:
If you want to understand energy outcomes in the real world, you cannot stop at “which technology is best.” Energy systems are governed by hard constraints (physics, networks, timelines) and soft constraints that act just as hard (rules, institutions, contracts, incentives, human behavior). Models are how you test what must be true for a plan to work.

An energy system is not just “power plants” or “the grid.” It is the whole chain that turns physical resources into services people actually use, under rules that decide who can build, who gets paid, and who carries risk.
If you zoom out far enough, the system starts with primary energy resources (coal, natural gas, uranium, wind, sunlight, water flows), runs through conversion machines (turbines, boilers, photovoltaic cells, refineries, engines), and ends at the point where someone gets light, heat, motion, computation, or industrial output.
A useful way to see this is a national energy flow chart: one side shows inputs by source, the other side shows where it ends up by sector, with large blocks of “rejected energy” representing losses from conversion and use.
[PICTURE: U.S. energy flow Sankey showing primary sources to end-use sectors and “rejected energy,” CREDIT TO LLNL [1]
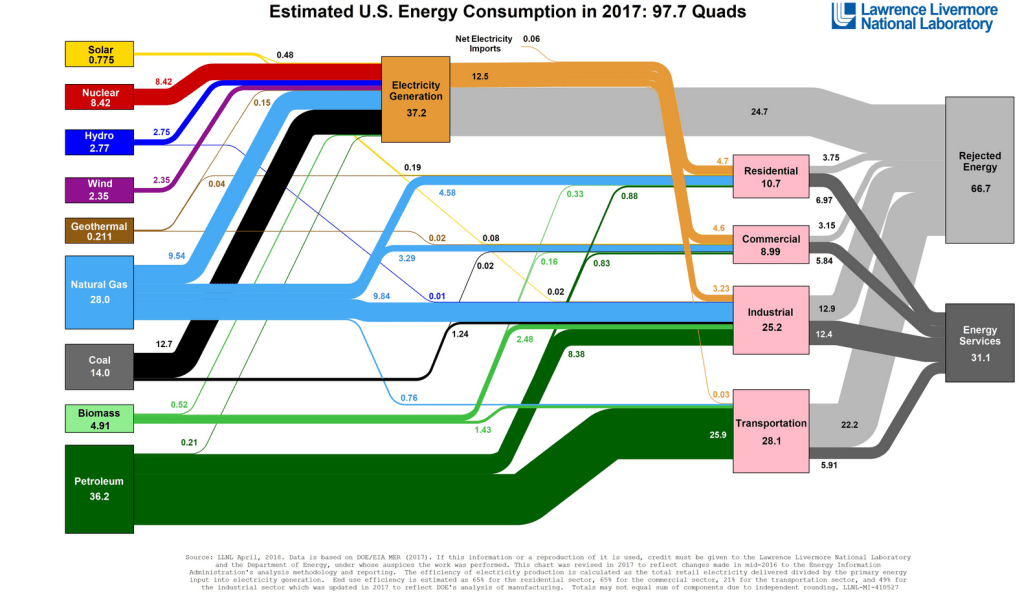
Electricity is only one slice of the broader energy system, but it is the slice where modeling often gets the most attention because it has tight real-time constraints. In 2023, the United States generated about 4,178 billion kilowatthours of electricity at utility-scale facilities, roughly 4.18 trillion kWh. About 60% of that came from fossil fuels, 19% from nuclear, and 21% from renewables. [2] Those numbers describe energy produced at generators, not energy that arrives as useful work at your device. Even in a well-run grid, some energy is lost moving power through wires and transformers. The EIA estimates that transmission and distribution losses averaged about 5% of electricity transmitted and distributed in 2018–2022. [3] That number is not a moral failure, just plain physics and the result of our historical infrastructure choices. That loss matters a lot for planning: a model that treats delivered electricity as identical to generated electricity silently assumes away a real, measurable wedge. On the scale of U.S. generation, 5% of 4.18 trillion kWh is on the order of 200 billion kWh per year, which is large enough that you can be wrong about system costs and emissions simply by forgetting where the meter is.
A clean mental anchor is the difference between power and energy, because it shows up everywhere in electricity systems and in the models built around them. Power is a rate (kW or MW). Energy is an amount accumulated over time (kWh or MWh). Think of how your car can use energy to go thirty miles (value), or it can have the power to go 30 miles and hour (rate).

A battery has both a power rating (how fast it can charge or discharge) and an energy capacity (how much it can store). If you confuse the two, you will build models that look plausible but fail under basic dimensional checks. A concrete example: Tesla’s Megapack 2 XL is marketed as a grid-scale battery product with an energy capacity around 3.9 MWh and a power output around 1.9 MW (product specs vary by configuration, but this “roughly two hours at full power” relationship is the point). [4]
If you ask whether a battery can “replace” a generator, a model has to answer two separate questions: can it meet the instantaneous peak (power), and for how long (energy). The incentives question sits on top of that: even if it can, who pays it to be available, and under what market rules?
That layering—physics first, then institutions—is the reason energy systems are model-heavy. An energy model is a simplified representation of an energy system designed to make assumptions explicit and computable. “Model” can mean a spreadsheet with a few equations, a dispatch simulation that solves hourly supply and demand, a power-flow calculation that checks whether lines overload, a capacity-expansion optimization that chooses what to build over decades, or a market simulation that recreates how bids clear and revenues land. The common feature is not sophistication; it is discipline. A model forces you to state what you think matters, quantify it, and live with the consequences.
Models are used because energy systems are constrained in ways that intuition routinely mishandles. Electricity must balance supply and demand continuously. Equipment has ramp rates and minimum run levels. Transmission lines have thermal limits. Weather-driven resources vary. Demand varies by hour and season. Fuel prices move. Regulations change. Interconnection queues bottleneck. None of this means the future is “predictable,” but it does mean some failures are predictable. Models are best treated as tools for testing assumptions, not as machines that predict the future. If you run a model and get a single “answer,” you are usually seeing a single path through a maze of assumptions you did not notice you made.
A practical model behaves more like a lab bench than an oracle. You pick an assumption, change it, and watch what breaks. If solar costs fall 20%, what changes? If a transmission upgrade takes five years instead of two, what fails to get built on schedule? If natural gas prices double, what happens to dispatch, and which plants become marginal? If a market caps scarcity prices, does investment move elsewhere? These are not abstract questions. They show up in real systems because the binding constraints change, and models help identify which constraints are binding under which conditions.
Technical energy models focus on the physical and operational side. They answer questions like: can the system meet load in every hour given generator availability and weather? Do power flows violate line limits under N-1 contingencies? What amount of storage reduces curtailment under a given solar buildout? How much firm capacity is needed to hit a reliability target? Technical models have the advantage of being anchored to conservation laws and engineering limits. They also have a predictable failure mode: they can produce technically feasible solutions that are institutionally impossible. A plan that requires transmission permits to clear in 18 months is “feasible” in math and impossible in the real world.
Economic energy models focus on costs, prices, and tradeoffs, often compressing a complex system into a few comparable metrics. The most widely used example is levelized cost of energy (LCOE), which converts lifetime costs and lifetime energy output into an all-in cost per MWh. LCOE is useful because it puts unlike things on a common scale, but it is also easy to abuse because it hides system context. Lazard’s LCOE+ report, for example, presents LCOE ranges for new-build generation technologies; in its June 2024 edition, it shows utility-scale solar PV and onshore wind as among the lowest-cost new-build options on an unsubsidized basis, while also showing wide ranges that depend on financing, resource quality, and project specifics. [5]

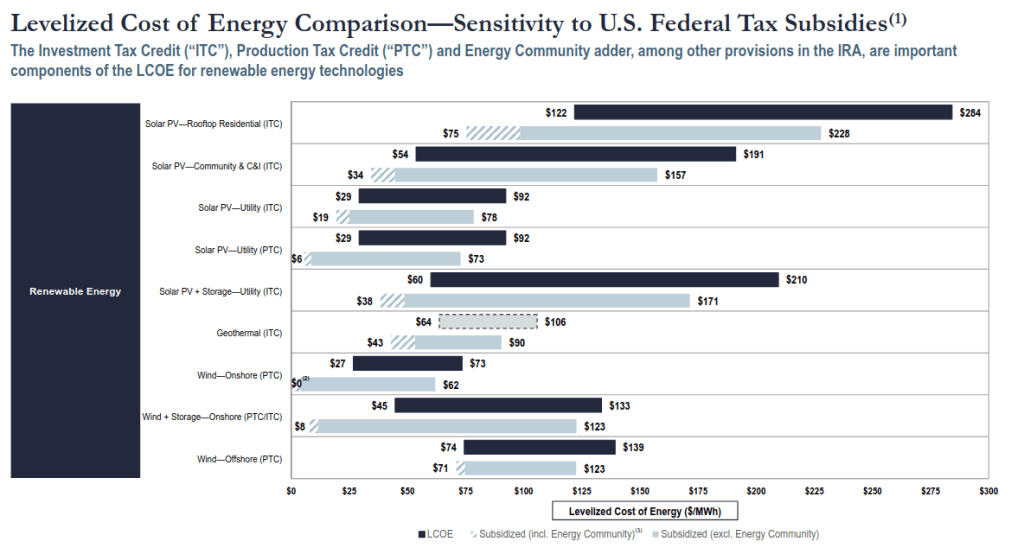
[PICTURE: LCOE bar chart showing overlapping ranges for utility solar, onshore wind, combined-cycle gas, peakers, etc., emphasizing that the output is a range, not a point.]

LCOE does not tell you whether the plant can interconnect, whether its output aligns with peak demand, whether it will be curtailed, whether it needs transmission, or whether it earns revenue under the local market design. Economic models that stop at LCOE tend to overstate “theoretical performance” because they ignore how the system pays for capacity, flexibility, and deliverability.
Regulatory models focus on rules, compliance, process, and constraints imposed by institutions. In energy, this is not a side topic; it is often the main bottleneck. A project can be technically sound and economically attractive on paper, then die in interconnection, permitting, or cost allocation. The U.S. interconnection queue is a blunt illustration. Berkeley Lab’s Queued Up 2024 edition reports about 2,600 GW of active generation and storage capacity sitting in U.S. interconnection queues—roughly twice the installed capacity of the entire U.S. power plant fleet (about 1,280 GW). [6] The system is not short on proposals; it is short on pathways that convert proposals into operating assets under current rules. FERC’s Order No. 2023 attempted to address this by requiring, among other things, cluster studies (studying groups of projects together rather than serially), stricter readiness requirements, and reforms to how upgrades are assigned and processed. [7]
A regulatory model is not just a legal summary. It is a representation of timelines, milestones, penalties, and decision rights—because those are the variables that determine what actually gets built.
Incentive-driven models cut across technical, economic, and regulatory categories by asking a more basic question: given the payoffs and constraints faced by each actor, what actions are they likely to take? In energy, incentives often shape outcomes more reliably than theoretical performance because institutions mediate almost every major decision. “Best technology” does not build itself. Someone has to finance it, interconnect it, insure it, operate it, and sell its output into a market whose rules can change.
A simple way to see incentive dominance is to look at markets that explicitly pay for reliability. PJM’s capacity market is one example. In the 2027/2028 Base Residual Auction, PJM reported that the RTO-wide clearing price hit the FERC-approved cap of $333.44 per MW-day, and the auction still cleared 6,623.2 MW UCAP less than PJM’s Installed Reserve Margin requirement. PJM’s auction report also describes an estimated total cost on the order of $16.4 billion for that delivery year. [8] Those are not “physics numbers.” They are rule outputs. They reflect what the market design will pay for accredited capacity, how much capacity cleared given de-ratings and offer behavior, and how scarcity is expressed when supply does not meet a reliability target. If you build a purely technical model that shows “enough megawatts exist,” you can still miss the real constraint: the market may not be paying for the right attributes, or it may be paying in a way that does not induce new entry fast enough.
ERCOT provides a complementary example because scarcity pricing is explicit. In late 2021, the Public Utility Commission of Texas approved an amendment lowering the high system-wide offer cap from $9,000/MWh to $5,000/MWh, effective January 1, 2022. [9] Separately, a value of lost load (VOLL) study prepared for ERCOT recommended proceeding with a system-wide VOLL of $35,000 per MWh (in 2024 dollars), with VOLL varying by customer class and outage duration. [10] Put those two facts next to each other and the modeling lesson shows up: the “value” of reliability is not a single natural constant, and the price signals used by markets are not automatically equal to the costs of outages borne by customers. They are policy choices and market design parameters. Incentive-driven models treat those parameters as levers that change behavior. A lower offer cap can reduce extreme price outcomes but may also reduce expected revenues for scarcity-dependent resources. A higher VOLL can justify more investment in reliability in planning models, but it can also collide with affordability and political constraints. None of these tradeoffs disappear because a technology has a low LCOE.
This is the core reason to keep repeating that models are assumption-testing tools, not future-prediction machines. The future is shaped by interacting systems: physical constraints, cost structures, institutional processes, and human decision-making. Models earn their keep when they clarify which assumptions drive results and where reality is likely to push back. A good model makes it hard to lie to yourself. It shows you what must be true for a conclusion to hold, and it makes uncertainty concrete by showing how outputs change when inputs move.
If you keep that frame, the main categories of energy models become less like a taxonomy and more like a set of lenses. Technical models tell you what is physically possible. Economic models tell you what is financially plausible under a given set of cost and price assumptions. Regulatory models tell you what is procedurally reachable under actual rules and timelines. Incentive-driven models tell you what is behaviorally likely given payoffs, constraints, and the fact that institutions do not reward “theoretical performance” directly. They reward compliance, risk management, and cash flows. When those four lenses disagree, the disagreement is usually the point.

10-most important takeaways

1. Energy is not “the grid.” It is a full chain: resources → conversion → networks → end-use services, plus the institutions that control the chain.
2. Power and energy are different constraints. Most confusion starts here. A battery’s MW rating answers “how fast,” its MWh answers “how long.” If you blur them, your conclusions are usually wrong.
3 The grid has real losses and frictions even before you argue about technologies. EIA’s ~5% transmission and distribution loss estimate is a reminder that where you measure matters, and scale turns small percentages into huge quantities.
4. A model is not a prediction machine. It is an assumption-testing tool. A useful model produces conditional statements: “If these rules and costs hold, then these outcomes follow.”
5. Technical models keep you honest about physics and reliability constraints. They prevent you from proposing systems that cannot balance, cannot deliver power, or violate network limits.
6. Economic models are necessary but easy to misuse. Metrics like LCOE help compare options, but they can hide the system context that determines whether a resource is valuable, deliverable, and financeable.
7. Regulatory constraints are often the bottleneck. The interconnection queue numbers (on the order of thousands of GW proposed versus roughly ~1,280 GW installed) show that “on paper” capacity is not the same as buildable capacity.
8. Incentives dominate outcomes more reliably than theoretical performance. What gets built is what can get permitted, financed, interconnected, and paid under the rulebook, not what looks best in a vacuum.
9. Market design parameters are not trivia. PJM’s capacity auction clearing at a price cap and ERCOT’s scarcity pricing choices illustrate that “reliability” gets translated into dollars through rules, and those rules shape investment.
10. When the four lenses disagree (technical, economic, regulatory, incentive), the disagreement is usually the point. That is where your model should focus, because that is where real-world outcomes diverge from clean theory

Sources

[1] Lawrence Livermore National Laboratory, Energy Flow Charts (and 2023 U.S. energy flow chart PDF).
[2] U.S. Energy Information Administration (EIA), “What is U.S. electricity generation by energy source?” (2023 total ~4,178 billion kWh and shares).
[3] EIA, “How much electricity is lost in electricity transmission and distribution in the United States?” (T&D losses averaged about 5% in 2018–2022).
[4] Tesla, Megapack product specifications (order/spec page and related technical description).
[5] Lazard, Levelized Cost of Energy+ (LCOE+) Version 17.0 (June 2024), LCOE ranges by technology. (https://lazard.com)
[6] Lawrence Berkeley National Laboratory, Queued Up: 2024 Edition (active queues ~2,600 GW vs installed capacity ~1,280 GW).
[7] Federal Energy Regulatory Commission (FERC), Explainer on the Interconnection Final Rule (Order No. 2023; cluster studies, readiness requirements; effective date and compliance timeline).
[8] PJM Interconnection, 2027/2028 Base Residual Auction Report (clearing at $333.44/MW-day cap; ~$16.4B total; 6,623.2 MW UCAP shortfall vs IRM).
[9] ERCOT Market Notice (PUCT amendment lowering high system-wide offer cap from $9,000/MWh to $5,000/MWh effective Jan 1, 2022).
[10] The Brattle Group, Value of Lost Load Study for the ERCOT Region (recommending $35,000/MWh system-wide VOLL; 2024 dollars).